What we'll cover
In the previous session we looked at what individual AI queries cost. This session zooms out to the infrastructure level: what powers the data centres that run AI, what it costs to build the hardware in the first place, and why the story of AI's environmental impact is more complicated than any single number can capture.
We will also engage with one of the most important ideas in sustainability economics: the Jevons paradox. The history of energy technology suggests that making a system more efficient does not necessarily reduce its total energy consumption. Understanding why this keeps happening, and whether AI might be different, is essential to thinking clearly about sustainable AI.
Mandatory readings
Gupta et al. (2021): "Chasing Carbon: The Elusive Environmental Footprint of Computing": IEEE HPCA peer-reviewed paper introducing a lifecycle framework for computing's carbon cost. Foundational reading for understanding why operational energy figures understate the true footprint; the capex/opex lifecycle framework is §II ("Quantifying environmental impact"), with manufacturing's share quantified in §V ("Environmental impact from manufacturing"). ≈1,500 words.
Wright et al. (2023): "Efficiency is Not Enough: A Critical Perspective of Environmentally Sustainable AI": argues that efficiency gains in AI are routinely offset by growth in scale and deployment. The most direct academic treatment of the rebound effect in AI; the rebound argument is §3 ("Discrepancy 2: Efficiency Across The Model Life Cycle"), drawn together in §5 ("Beyond Efficiency: Systems Thinking"). ≈2,500 words.
Patterson et al. (2022): "The Carbon Footprint of Machine Learning Training Will Plateau, Then Shrink" (Google): the optimist case, written by Google researchers. Read alongside Wright et al. for a balanced picture; the "4Ms" best practices are set out in §1, with the plateau case in §5 ("Overall ML Energy Consumption"). ≈1,500 words.
On the Patterson et al. paper: the authors are Google employees writing partly about Google's own practices and infrastructure. The paper's conclusions rely on advantages (access to TPUs, renewable purchasing, efficient cooling) that are not available to most researchers or smaller AI deployments.
Total mandatory load: ≈5,500 words.
Inside a data centre
To understand AI's energy footprint, it helps to understand what a data centre is and where the energy goes.
Compute: GPUs and servers
The energy-intensive heart of AI infrastructure is GPU-accelerated servers, specifically the NVIDIA H100 and H200 chips that dominate AI training and inference.
- A single H100 GPU has a thermal design power (TDP) of ~700W, roughly like running a small electric heater continuously
- A standard AI server rack might contain 8 GPUs: ~5.6 kW just for the compute
- A large data centre might house tens of thousands of such GPUs
- GPUs are the primary driver of recent data centre energy growth; the Lawrence Berkeley National Laboratory (2024) attributes most of the tripling of US data centre electricity use since 2014 to GPU adoption
Cooling: the water-energy trade-off
All that compute generates heat. Cooling is typically the second-largest energy consumer in a data centre after compute itself.
- Air cooling: Energy-intensive but uses little water; standard in older data centres
- Evaporative cooling: More energy-efficient but consumes large volumes of water (as discussed in 4.1)
- Liquid cooling: Emerging approach that pipes coolant directly to chips; reduces both energy and water use but requires specialised hardware
- Power Usage Effectiveness (PUE): Industry metric for cooling efficiency; 1.0 = perfect (all energy to compute), 1.5 = 50% overhead for cooling. Modern hyperscaler data centres achieve ~1.1–1.2; older facilities often 1.4–2.0
Power: getting electricity in
Large data centres require substations, high-voltage transmission lines, and often dedicated utility agreements.
- A 100 MW data centre is roughly equivalent to a small town's electricity demand; getting this connected to the grid takes years and significant infrastructure investment
- This is why AI companies are signing long-term power purchase agreements (PPAs) and, in some cases, directly investing in power generation
- The speed of AI infrastructure buildout is outpacing the pace at which utilities can build new grid capacity, creating bottlenecks and, in some cases, pressure to bring fossil fuel generation back online
Where the electricity comes from
The carbon footprint of AI electricity use depends entirely on how that electricity is generated, and this varies enormously by geography and by time of day.
Carbon intensity of electricity by location
The "carbon intensity" of electricity (how much CO₂ is emitted per kilowatt-hour) varies enormously depending on the local grid's energy mix:
| Location / grid | Approx. carbon intensity (kg CO₂/kWh) | Main sources |
|---|---|---|
| Norway | ~0.02 | ~98% hydroelectric |
| France | ~0.06 | ~70% nuclear |
| UK | ~0.23 | Mixed: wind, gas, nuclear |
| US average | ~0.39 | ~60% fossil fuels (gas + coal), 40% nuclear + renewables (EIA, 2024) |
| Australia | ~0.51 | High coal dependence, growing renewables |
| South Africa | ~0.90 | ~80% coal |
| Poland | ~0.77 | Heavily coal-dependent |
Research by Dodge et al. (2022, Allen Institute for AI) found that choosing a low-carbon cloud region over a high-carbon one can reduce the carbon footprint of an identical AI workload by up to 80%, with zero change to the model or code. This is one of the most impactful and underutilised levers available to researchers.
Renewable energy claims
Major tech companies (Google, Microsoft, Amazon) claim to run on 100% renewable energy. This is technically accurate but requires careful interpretation.
- Energy Attribute Certificates (EACs): Companies often purchase certificates that say a renewable source generated a certain amount of electricity, but the renewable electricity may be generated at a different time or place than when the AI is running
- 24/7 matching: A more rigorous standard, where renewable supply is matched to consumption hour by hour. Google has committed to this; others have not
- Additionality: Does the company's purchase cause new renewable capacity to be built, or does it just buy existing credits? The former is more meaningful
- The grid still matters: Even with renewable certificates, if a data centre draws from a coal-heavy grid at peak demand, it is still causing fossil fuel generation to run
Case study: nuclear and the AI energy rush
The scale of AI's electricity demands is forcing AI companies to think creatively about power supply, and sometimes controversially:
- Three Mile Island (Microsoft): Microsoft signed a 20-year power purchase agreement with Constellation Energy to restart Unit 1 of the Three Mile Island nuclear plant in Pennsylvania (closed since 2019) specifically to power its AI data centres. September 2024 marked that announcement, not a restart: the reactor (to be renamed the Crane Clean Energy Center) is scheduled to come back online around 2027, after an estimated $1.6 billion refurbishment and pending Nuclear Regulatory Commission approval.
- xAI in Memphis: Elon Musk's xAI company operated a data centre on gas turbine generators while awaiting grid connection permits. Reports in 2024 indicated generators running at significant capacity before permanent utility power was connected.
- What this tells us: When grid connection is too slow or too carbon-heavy, AI companies are willing to invest in or restart generation capacity directly, a sign of how seriously they view electricity supply as a constraint on AI growth.
Data centres and electricity prices
The evidence points both ways. Research by the Electric Power Research Institute found that data-centre demand put downward pressure on average US retail prices through 2024: a grid's fixed costs spread over more kilowatt-hours, and average residential rates in the average state would have been about 6% higher without the data centres built from 2019 to 2024 (Marketplace, 2026). Against that, the independent market monitor for PJM, the largest US wholesale electricity market, attributes more than $23 billion in added capacity-market costs since 2025 to existing and forecast data-centre demand (Fortune, 2026). Fixed-cost spreading lowers average prices while supply keeps pace; capacity-auction scarcity raises them when it does not. A claim in either direction needs its market, its period and its mechanism.
Embodied carbon: the cost of making the hardware
Almost all analyses of AI's carbon footprint focus on electricity consumption during operation. But there is another carbon cost that is often omitted: the emissions released when manufacturing the hardware in the first place.
Semiconductor manufacturing emissions
Semiconductor manufacturing is one of the most energy and materials-intensive industrial processes in existence. Fabricating a modern AI chip requires hundreds of processing steps, ultrapure water, specialised gases, and enormous amounts of electricity, typically from grids that are not carbon-neutral.
Research by Gupta et al. (2021, Harvard/Meta) found that for computing hardware overall, embodied emissions (the carbon released in manufacturing) can represent 50–80% of the total lifecycle carbon footprint. This is particularly significant for AI hardware, because GPUs are replaced on rapid cycles as new, more powerful chips become available.
Components of embodied carbon
- Chip fabrication: Semiconductor fabs (TSMC, Samsung, Intel) consume enormous electricity and specialised chemicals
- Rare earth minerals: Mining and refining of materials used in chips and cooling systems
- Server assembly: Manufacturing of boards, memory, storage, power supplies
- Data centre construction: Steel, concrete, electrical infrastructure
- Transport: Global supply chains for components
Rapid hardware turnover
AI companies are replacing GPU generations very rapidly; NVIDIA releases new flagship architectures roughly every 1–2 years (Ampere → Hopper → Blackwell).
- Each replacement cycle requires manufacturing new hardware and disposing of old hardware
- The manufacturing emissions of a data centre's GPU fleet are incurred again each cycle
- This is not reflected in operational electricity figures
- It means that efficiency gains from newer, more capable chips are partially or fully offset by re-manufacturing costs
The growth trajectory
Individual query costs and per-data-centre figures only tell part of the story. The trajectory of AI energy demand matters as much as the current level.
US data centre electricity demand: past and projected
| Year | US data centre electricity | Context |
|---|---|---|
| 2014 | ~60 TWh/year | Pre-deep-learning era; mostly traditional cloud computing |
| 2023 | 176 TWh/year (4.4% of US electricity) | Roughly tripled over the decade; GPU-accelerated servers the primary driver (LBNL, 2024) |
| 2028 (projected) | 325–580 TWh/year | LBNL 2024; ≈6.7–12% of US electricity. High uncertainty. |
Compare projections only after checking their scope and baseline year. The IEA’s Electricity 2024 estimate grouped data centres, AI and cryptocurrency when discussing demand approaching 1,000 TWh in 2026. Energy and AI (2025) reports a data-centre baseline of 415 TWh in 2024 and projects around 945 TWh in 2030. Differences between those figures cannot be read as a simple revision of the same series.
The IEA's updated 2025 trajectory: doubling by 2030
The IEA's dedicated Energy and AI report (2025) provides a dated baseline and projections. The following figures refer to that 2025 report:
- Global data-centre electricity rising from approximately 415 TWh in 2024 to approximately 945 TWh in 2030, just under 3% of projected global electricity consumption.
- Electricity for AI-optimised data centres more than quadrupling by 2030, the fastest-growing part of the total.
- Data-centre CO2 staying under ≈ 1.5% of energy-sector CO2 (≈ 180 Mt today rising to ≈ 300 Mt by 2035).
For comparison, Hannah Ritchie's analysis of the IEA's World Energy Outlook 2024 projections (Sustainability by Numbers, November 2024) put the increase in total data-centre electricity demand by 2030 at ≈ 223 TWh, about 3% of global demand growth, on the order of South Africa's annual electricity use, and well below the projected 2030 increase from air conditioning (≈ 697 TWh) or electric vehicles (≈ 854 TWh). Those figures come from an earlier projection vintage than the Energy and AI numbers above, but the comparison survives the revision: the trajectory is steep on its own terms; it is not steep enough on its own to dominate the broader electricity-demand picture.
The rebound problem: Jevons paradox
Perhaps the most important concept for thinking clearly about AI's long-term environmental trajectory, and one that receives far too little attention in optimistic narratives about AI efficiency improvements.
The Jevons paradox
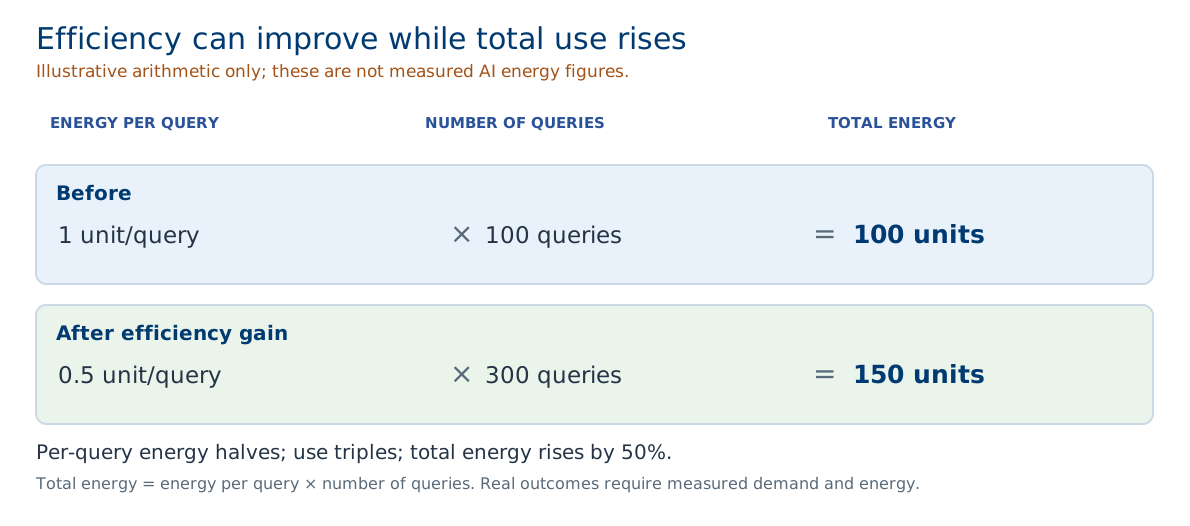
In 1865, the economist William Stanley Jevons observed that improvements in the efficiency of steam engines did not reduce coal consumption in Britain; they increased it, because lower operating costs made steam power affordable for more applications.
The general principle: when a resource becomes cheaper or more efficient to use, consumption tends to increase rather than decrease, because efficiency opens up new uses and new users. The cost savings from efficiency gains are "rebounded" into increased consumption.
This is not a historical curiosity. It has been documented repeatedly across transport, computing, lighting, heating, and manufacturing over the past two centuries.
Jevons in AI: the evidence so far
AI hardware has become dramatically more efficient over time. NVIDIA's own marketing claims a 45,000× improvement in the energy efficiency of large-model inference over eight years, and up to 100,000× over a decade for generating tokens. Yet total AI energy consumption has grown. The size of the claimed gains strengthens the rebound argument: if efficiency improved ten-thousand-fold while consumption still rose, efficiency alone does not reduce demand.
- More efficient chips enable larger models: As inference becomes cheaper per query, companies build larger, more capable models that cost more per query
- More efficient models enable more applications: Lower costs enable deployment in use cases that would previously have been uneconomic
- More users: As AI becomes more accessible and cheaper, adoption grows rapidly
- The net result: Total energy consumption has grown alongside efficiency improvements
The optimist response
Not everyone agrees that Jevons necessarily applies to AI in the long run. Some arguments on the other side:
- Grid decarbonisation: If electricity supply becomes predominantly renewable, then growth in AI electricity demand no longer implies growth in carbon emissions
- Saturation: At some point, AI capability may plateau and deployment growth may slow
- Algorithmic efficiency: Improvements in model architecture (like MoE) reduce the compute required to achieve a given capability level
- Policy intervention: Regulation could constrain growth in a way that market forces do not
These are real possibilities, but they require assumptions about the future that are far from certain.
Reading the efficiency claims critically
When AI companies or optimistic commentators cite efficiency improvements (e.g. "our new model uses 44% less energy per query"), this is valuable information, but it does not tell you what happens to total energy use if deployment grows faster than efficiency improves. Always ask: what is the denominator? Efficiency per query, or total annual energy consumption?
Corporate environmental action
Understanding what AI companies are doing, versus what they say they're doing, is essential background for any researcher or policymaker engaging with this topic.
Actions taken
- Renewable energy purchasing: Major tech companies are among the world's largest corporate buyers of renewable energy; this does contribute to new renewable capacity
- Data centre efficiency: Google, Microsoft and Meta have made real improvements in PUE (cooling efficiency) over time
- Hardware efficiency: Newer GPU generations achieve substantially more compute per watt
- Location choices: Some companies site data centres in regions with high renewable availability (Norway, Iceland, parts of the US Pacific Northwest)
- Architectural innovations: Mixture-of-Experts, quantisation, and other techniques reduce compute per query
The limits
- Total demand is growing faster than renewable supply: Even large renewable purchases don't keep pace with AI electricity demand growth
- Disclosure is voluntary and inconsistent: Companies choose what to report and how; independent verification is rare
- Embodied carbon is almost never reported: Hardware manufacturing emissions are excluded from most corporate sustainability claims
- Scope 3 emissions: The indirect emissions from supply chains (including chip manufacturing) are often excluded from reported figures
- Nuclear and gas bridging: In some cases, companies are accepting or actively facilitating fossil fuel or nuclear generation to meet short-term demand
Summary and key takeaways
- Location determines carbon impact: An identical AI workload can have 80% different carbon emissions depending on where it runs; this is the single most impactful lever for individual researchers
- Embodied carbon is systematically ignored: Manufacturing GPUs and building data centres releases significant carbon that is absent from most reported figures
- US grid is ~60% fossil fuels: Company "100% renewable" claims use accounting methods that do not change this physical reality at the point of consumption
- AI electricity demand is growing rapidly: From ~60 TWh in 2014 to 176 TWh in 2023 (4.4% of US electricity) in the US alone, with LBNL projecting 325–580 TWh by 2028
- Jevons paradox is the central challenge: Efficiency gains in AI hardware and algorithms have so far been outpaced by growth in deployment and model scale
- Companies are doing real things, but not enough: Renewable purchasing and efficiency improvements are real but insufficient to keep pace with demand growth
Next (4.3): Before we reach practical solutions, there's another layer to the AI environmental story: the raw materials that make AI hardware possible at all. We'll look at critical minerals, supply chain geopolitics, and what the rush for AI chips means for communities and ecosystems around the world.